Traash
Well Known Member
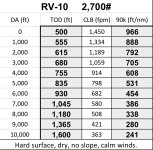
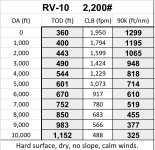
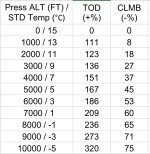
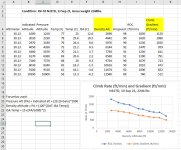
Flying IFR in high Density Altitude conditions reminded me that I needed a better way to calculate takeoff and climb performance. I used the online interactive Koch chart (takeofflanding.com) to tabulate performance changes to takeoff distance and climb rates. This gave me percentage changes from sea level performance. I took the Vans published sea level takeoff distance and Vy numbers and developed an Excel spreadsheet to calculate TOD (Takeoff Distance) and CLB (Climb rate) adjusted for Density Altitude. Since Vy is close to 90K for most RV's and my initial deck angle of 10* gives me 90k, I calculated the feet per nautical mile at that speed which can be compared to Departure Procedure requirements. Using the known length of the runway centerline stripes (200' between stripes) and the Density Altitude and climb gradient displays on the G3X I did 4 comparisons of TOD and FT/NM at DA's from 7 - 10K'. They all compared favorably. The table is a bit on the conservative side. I found out that I can't takeoff into minimum IMC at Gunnison, CO and must use the VCOA (Visual Climb Over Airport) method to depart IFR.
The tables are derived using Van's published numbers. If you test your aircraft and find different results, you can change the sea level TOD and CLB entries and the excel spreadsheet will do the remaining calculations for you.
The tables are derived using Van's published numbers. If you test your aircraft and find different results, you can change the sea level TOD and CLB entries and the excel spreadsheet will do the remaining calculations for you.