KeithO

Well Known Member
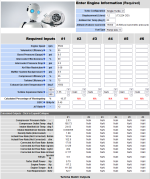
I have run some turbocharger operating point calculations using the Garrett "Boost Advisor" predictive tool. Basically trying to understand what happens to the turbo operating point from sea level to 15k ft. The first thing I did was to put together a table of atmospheric conditions from sea level to 30k ft. This would be absolute pressure and temperature in 2500ft increments. I was able to use the temperature data in the "Boost Advisor".

The thing that baffles me regarding the results is that the tool suggests that to make the SAME hp at increasing altitude requires progressively higher mass flow with altitude. Higher air flow means higher fuel flow which should equate to more power ? What am I missing ? This seems to violate some law of physics.
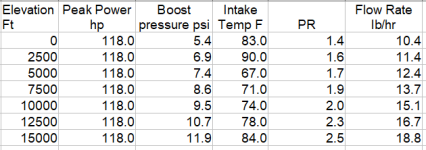
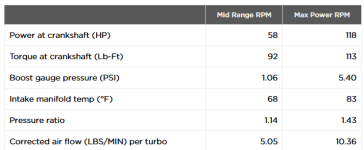
1713208318471.png

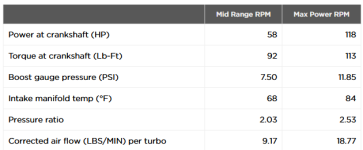
1713208428016.png
 
Last table being "volumetric flow" would make more sense of the associated numbers. Looking forward to the answer.
 
Here are some examples:
The first is for sea level. 60F ambient, 120hp target,1.2L 4 valves per cylinder 5500rpm air to air intercooler, pump gas
Note 10.36 lb/min air mass flow rate. Just like expected.
1713209417817.png

Now 15 000ft. 23.7F ambient, 120hp target, 1.2L 4 valves per cylinder 5500rpm air to air intercooler, pump gas
Note 18.77 lb/min air mass flow rate. Almost double ???
1713209641503.png


Units corrected as per Prof Turner...... Eagle Eye
 
Last edited:
In reviewing the table of results last night, I get the impression that the boost gauge is reading higher only because the altitude is increasing. Its not an absolute pressure gauge. I believe that if one was to measure the manifold absolute pressure it is constant. I think that the programmer made a mistake to use the boost value instead of the MAP to calculate engine mass flow and that is the reason why the mass flow values increase the way that they do. It seems like they have a serious programming error with their predictive tool. Im pretty sure that if the engine controller was to maintain the MAP at a constant value, this would yield a constant power output and also a constant engine mass flow.
 
What equipment (aircraft/engine) are you discussing?
The engine in question is a Mitsubishi A392 from a Mitsubishi Mirage. 3 cylinder, 1.2L 4 valve per cylinder. Im planning on putting together a turbocharged 120hp variant with a geared reduction drive. The turbo should allow flat rating to about 14k ft. Finding a prop that can absorb 120hp up to 14k should be very interesting, would have to be variable pitch. I know that DUC has variable pitch props with an electro hydraulic actuator, which currently would be the best option for someone who didnt want to have to throttle back much at altitude. Its intended as a Jabiru 3300 or Rotax 912ULS or O235 substitute.
 
I have run some turbocharger operating point calculations using the Garrett "Boost Advisor" predictive tool. Basically trying to understand what happens to the turbo operating point from sea level to 15k ft. The first thing I did was to put together a table of atmospheric conditions from sea level to 30k ft. This would be absolute pressure and temperature in 2500ft increments. I was able to use the temperature data in the "Boost Advisor".

The thing that baffles me regarding the results is that the tool suggests that to make the SAME hp at increasing altitude requires progressively higher mass flow with altitude. Higher air flow means higher fuel flow which should equate to more power ? What am I missing ? This seems to violate some law of physics.

View attachment 60746

View attachment 60747
You are missing the fact that fuel and oxygen mix to combust, NOT fuel and air. Nitrogen and hydrogen just get in the way, though the combustion process does create some molecular combing of these components. As altitude increases, air density decreases. What this means is that as air density decreases, the oxygen content of any given cubic parcel of air reduces. Therefore, when determining how much fuel is required to reach a constant air fuel ratio (technically an oxygen / fuel ratio) or a constant HP level (which is based upon a constant mass of air mixed with a constant mass of fuel) one must use a proportional combination of airflow volume AND air density or simply mass airflow (which accounts for both), depending upon how fuel delivery is managed by the equip. The quoted chart does NOT say that mass airflow must increase with altitude and that is correct; as altitude increases, the volume of air flow increases, but not mass of that air flow. The quoted chart says that boost pressure must increase with altitude nad that is also correct. As the air gets less dense with altitude a greater amount of boost is required. It is not really that more boost is required as it is that fact that the pressure gauge is not relative to ambient, but instead calibrated to sea level pressure. Therefore the INDICATED boost level must rise with higher altitudes to deliver the same mass airflow as it did at SL. (Think IAS and TAS relationship). The boost gauge lies at altitude for the same reason that the IAS lies at altitude and the operator must correct for it.

Clear as mud, right? Lots of implied science here that is not expressly called out here, so proceed with caution.

Larry
 
Last edited:
You are missing the fact that fuel and oxygen mix to combust, NOT fuel and air. Nitrogen and hydrogen just get in the way, though the combustion process does create some molecular combing of these components. As altitude increases, air density decreases. What this means is that as air density decreases, the oxygen content of any given cubic parcel of air reduces. Therefore, when determining how much fuel is required to reach a constant air fuel ratio (technically an oxygen / fuel ratio) or a constant HP level (which is based upon a constant mass of air mixed with a constant mass of fuel) one must use a proportional combination of airflow volume AND air density or simply mass airflow (which accounts for both), depending upon how fuel delivery is managed by the equip. The quoted chart does NOT say that mass airflow must increase with altitude and that is correct; as altitude increases, the volume of air flow increases, but not mass of that air flow. The quoted chart says that boost pressure must increase with altitude nad that is also correct. As the air gets less dense with altitude a greater amount of boost is required. It is not really that more boost is required as it is that fact that the pressure gauge is not relative to ambient, but instead calibrated to sea level pressure. Therefore the INDICATED boost level must rise with higher altitudes to deliver the same mass airflow as it did at SL. (Think IAS and TAS relationship). The boost gauge lies at altitude for the same reason that the IAS lies at altitude and the operator must correct for it.

Clear as mud, right? Lots of implied science here that is not expressly called out here, so proceed with caution.

Larry
I think I have figured out the boost gauge part, and that it is the "indicated" boost value that is increasing. The control target is to maintain a constant Manifold Absolute Pressure. If you do that you have the "normal" amount of oxygen needed. The ratio of oxygen to nitrogen does not change with increase in altitude (at least not up to 15k ft). All one has to do is compress the air to the same absolute pressure as at sea level + the target boost amount and you have everything the engine needs to produce the full output. I think the programmer who worked on the tool made an error in using the "indicated" boost value to calculate the mass flow which is why the mass flow increases with altitude. It seems a pretty massive error for such a big company to make with a public facing predictive tool.
 
The ratio of oxygen to nitrogen does not change with increase in altitude (at least not up to 15k ft). All one has to do is compress the air to the same absolute pressure as at sea level + the target boost amount and you have everything the engine needs to produce the full output.
No, the ratio doesn't change, but the total quantity of molecules does. For example, at sea level a 1 cubic inch parcel of air may have 1,000,000 oxygen molecules. At 10,000 feet, that same 1 cubic inch may only have 875,000 oxygen molecules. The hydrocarbon molecules are liquid and therefore unaffected by altitude, at least as it relates mass vs volume.

Larry
 
I think I have figured out the boost gauge part, and that it is the "indicated" boost value that is increasing. The control target is to maintain a constant Manifold Absolute Pressure. If you do that you have the "normal" amount of oxygen needed.
The target to maintain is mass airflow. Manifold absolute pressure cannot be used as a surrogate without IAT. Yes, MAP with temp correction can be used to match to fuel flow and it was done this way in the early FI systems. However, If I recall correctly, they all had baro readings and compensation, so ambient pressures clearly were influenceing something. It wasn't until the move away from speed density to MAF that we could drop the baro sensors.
 
The target to maintain is mass airflow. Manifold absolute pressure cannot be used as a surrogate without IAT. Yes, MAP with temp correction can be used to match to fuel flow and it was done this way in the early FI systems. However, If I recall correctly, they all had baro readings and compensation, so ambient pressures clearly were influenceing something. It wasn't until the move away from speed density to MAF that we could drop the baro sensors.
I didnt mention IAT but that will certainly be provided and used by the engine controller. I will not have a mass flow meter.
 
The target to maintain is mass airflow. Manifold absolute pressure cannot be used as a surrogate without IAT. Yes, MAP with temp correction can be used to match to fuel flow and it was done this way in the early FI systems. However, If I recall correctly, they all had baro readings and compensation, so ambient pressures clearly were influenceing something. It wasn't until the move away from speed density to MAF that we could drop the baro sensors.
As you will note from the table, post intercooler temperature does not vary a great deal. At higher altitude with the compressor working harder it gets heated up more, but the ambient temperature is quite low, so no substantial increase over lower altitude.
 
The old professor in me wants to know why some mass air flow numbers are marked as pounds per minute, others as pounds per hour. Simple mistakes like this always make me think the writer is somewhat careless.
 
The old professor in me wants to know why some mass air flow numbers are marked as pounds per minute, others as pounds per hour. Simple mistakes like this always make me think the writer is somewhat careless.
They should all be lb/min. Im a metric guy. We usually talk about kg/hr or gram/sec....
 
Good luck with your research, KeithO. It would be interesting to follow any updates. I dabbled with turbos a while back and was familiar with the Garrett literature. Planned to super size an existing aircraft engine installation with a turbo. Learned a lot.

The "Boost Advisor" does not seem the have an altitude input according to a Garrett page, just ZIP code, a meager source for air density. So the crazy results seem to be from the app using this dumbed down simplified constant density.

Since turbo compressor maps basically deal in volume, the x axis will be mass flow only if a given air density has been applied. Altitude requires "corrected flow" as mentioned up thread. Otherwise the map x axis is volume or mass corresponding to air at STP. The operating line will lean to the right with altitude increase for near constant mass flow and horsepower as yours does as the needed volume increases with altitude

I learned that mapping to get 200 HP at 20K feet rather than SL for a give engine, more volume is needed for the lower density and that means a larger compressor sized near 400 hp at sea level will be needed for efficiency.
 
Usually compressor maps like this use sea-level-corrected mass flow on the horizontal axis. The actual physical mass flow is much less. The physical mass flow is multiplied by the square root of the temperature ratio, (T/T_o) and divided by the pressure ratio (P/P_o). T_o and P_o are the sea-level standard temperature and pressure.
Usually this is written as w-root(theta)/delta, where w is the mass flow (lb/s), theta= temp ratio and delta= pressure ratio. Note that P/P_o becomes less than 1.0 pretty fast as you go up in altitude, so dividing by it makes the "corrected" mass flow larger.

The reason for using the sea-level-corrected mass flow on the compressor map is that this way, one map can be used for all operating conditions. You just have to correct your physical airflow. It is kind of like using Indicated Air Speed on a flight envelop chart.

My bet is that if you go back and compute physical mass flow from the table, you will find it is nearly constant, as you expected. Constant true mass flow, constant fuel flow, and constant horsepower. None EXACTLY constant because the compressor efficiency varies, the charge temperature varies, the back pressure (pumping loss) on the engine varies, etc. But it will be close.
 
Last edited:
Good luck with your research, KeithO. It would be interesting to follow any updates. I dabbled with turbos a while back and was familiar with the Garrett literature. Planned to super size an existing aircraft engine installation with a turbo. Learned a lot.

The "Boost Advisor" does not seem the have an altitude input according to a Garrett page, just ZIP code, a meager source for air density. So the crazy results seem to be from the app using this dumbed down simplified constant density.

Since turbo compressor maps basically deal in volume, the x axis will be mass flow only if a given air density has been applied. Altitude requires "corrected flow" as mentioned up thread. Otherwise the map x axis is volume or mass corresponding to air at STP. The operating line will lean to the right with altitude increase for near constant mass flow and horsepower as yours does as the needed volume increases with altitude

I learned that mapping to get 200 HP at 20K feet rather than SL for a give engine, more volume is needed for the lower density and that means a larger compressor sized near 400 hp at sea level will be needed for efficiency.
https://www.garrettmotion.com/racin...er-finding-the-correct-turbo-for-your-engine/Take another look before making assumptions
 
The old professor in me wants to know why some mass air flow numbers are marked as pounds per minute, others as pounds per hour. Simple mistakes like this always make me think the writer is somewhat careless.
most all MAF sensors currently installed today provide readings in Grams per Second. Obviously this can be converted to all sorts of other metrics.
 
So to start this over in a sense below is an atmospheric table from sea level to 15K with the absolute air pressure in kPa and Psi and temperature in F and C

The target boost value for the application at sea level is 5psi or 34.47 kPa. Thus the design manifold absolute pressure is 19.7Psi or 135.8kPa

Altitude ft​
Pressure kPa​
Pressure Psi​
Temperature C​
Temp F​
0​
101.33​
14.70​
15.0​
40.3​
2500​
92.50​
13.42​
10.0​
37.6​
5000​
84.30​
12.23​
5.0​
34.8​
7500​
76.71​
11.13​
0.0​
32.0​
10000​
69.67​
10.11​
-5.0​
29.2​
12500​
63.17​
9.16​
-10.0​
26.4​
15000​
57.17​
8.29​
-15.0​
23.7​

Now considering our operating points
Sea level: Ambient Pressure 101.33 This equals the turbo inlet condition in absolute pressure. The target outlet pressure is 135.8kPa So the pressure ratio is 135.8/101.33 = 1.34 We are not considering pressure drop in any air filter or intercooler plumbing in this simple scenario.

Now lets look at 15k. Ambient pressure is 57.17 kPa Outlet / Manifold pressure would be 135.8kPa Pressure ratio is 135.8/57.17 = 2.37

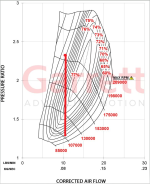
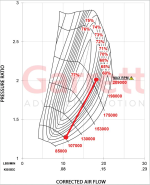
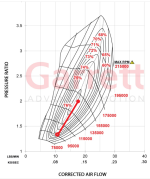
For identical horsepower the mass flow has to be the same. The calculated mass flow at sea level is 10.3lb/min. At altitude to make the same power the engine would need the same mass flow of air and fuel as at sea level. The question as to whether the prop is able to absorb this power, and if it can, whether or not the airframe would exceed VNE is a separate issue from merely making the power. Illustrating these 2 points on the turbo map below:
1713393752636.png

One can see that the bottom sea level operating point is heading to the choked flow region of the map in the ca 60% efficient range. As altitude increases one passes through the "sweet spot" for efficiency in the 75% range. Then as one climbs higher one gets closer to the stall line of the compressor on the left, because we are only demanding 120hp where the turbo is sized for 200hp. In reality one would be wise to program a detuning of the turbo with altitude in keeping with what a good prop can deal with without running into the rev limiter. This would then limit the maximum pressure ratio to a lower number and the engine will start making less hp at higher altitudes.

The airport nearest me is at 8000ft, it would be great to have full rated power at that altitude to have good take off and climb performance. The mountains surrounding Custer county are at 14k ft and one would need some clearance to that and the naturally aspirated Jab 3300 has had enough performance to clear those no problem. The builder of my Lightning built it in Colorado and flew over the mountains on a regular basis. So most likely this engine would have a lot more practical performance than the Jab 3300. But it would make sense not to push it to full power at 15k ft. Using that amount of power would probably require an in flight adjustable DUC prop which is quite expensive.... And the subject of VNE will be back on the table.
 
Last edited:
Kudos for the correction. My comment was not based on an assumption, but referenced to a likely out-of-date description of Garrett's app from:
https://www.turbomaster.info/eng/tools/boost_adviser.php . I dimly remember a Garrett calculator that was clumsy to use for varying altitudes.

Regarding compressor maps, all these compressor maps, of which I have a big collection and had been dealing with occasionally for decades are basically pressure vs intake volume maps. To make them more directly useful, a fixed density of the air is usually applied to the bottom scale, the x axis. (usually standard SL density giving a resulting mass flow flow in g/min, lbs/hr, etc. rather than volume.)

To then use the map at some other air density, the bottom scale must be changed. Due to less air density with increased altitude, a given weight of air will have more volume and therefor the map point must be further to the right. A minor correction for temperature is needed as well. (This is a Mach adjustment to maintain map similarity.)

Applying all this to the map you posted today, this is good news. If you move the upper dot representing 15K ft alt, the dot will be almost directly over the max efficiency line when corrected for volume! The volume increase required to get the same mass flow as SL is ~63% more and close to a bulls eye for your stated use. The effect of temp (compressor mach) is 5% - so ignored for now.
Good Luck
ron
When the units on the X scale change, so too does the shape of the map. You cant have an operating point on 20lb/min without the turbo delivering 20lb/min. Thats the entire reason why the map was switched from volumetric flow to Mass flow in the first place. They set up the device on a test stand and put a mass flow meter on the inlet and a variable restriction on the outlet and connect up the turbine speed sensor so they know the speed and then work their way through the map. If one uses a back pressure regulator like the sort made by equilibar it will hold a constant backpressure on the outlet and all they have to do run from low to high speed through the operating range. For low inlet pressures for altitude they can add a pressure regulator to the inlet and generate vacuum. Then set the next higher back pressure and go again. Then the data will get post processed at which time they calculate the compression efficiency for each point based on how much higher the temperature is vs the theoretical compression work for a 100% efficient system.

An actual turbo manufacturer more than likely characterize the turbine and compressor wheels independently by driving the compressor with a high speed electric motor so that they know exactly how much power it absorbs at each point in the map. The turbine wheel the opposite way by driving it with exhaust gas and then absorbing the generated power with a brake so that they know the turbine output across the range. Then for applications they would pick a turbine and a compressor based on the known performance of each and they can then calculate the map very accurately before they have even run the combination.
But the chart says "corrected Air Flow." Why are you assuming that is mass airflow? Very possible that they assume the mass of air at sea level and then correct the flow number to a mass number. If the chart truly was based on mass airflow, I am pretty confident that the Engineer would have labelled the X axis Mass Airflow. He clearly uses the term corrected, so seems logical that he corrects the volume for mass at SL and changes ratio from volume to weight. THere is a big difference between airflow and mass airflow. The former measures the volume of flowing gas and the other measures the weight of flowing gas.
 
Last edited:
But the chart says "corrected Air Flow." Why are you assuming that is mass airflow? Very possible that they assume the mass of air at sea level and then correct the flow number to a mass number. If the chart truly was based on mass airflow, I am pretty confident that the Engineer would have labelled the X axis Mass Airflow. He clearly uses the term corrected, so seems logical that he corrects the volume for mass at SL and changes ratio from volume to weight. THere is a big difference between airflow and mass airflow. The former measures the volume of flowing gas and the other measures the weight of flowing gas.
It (the X axis) has a unit. lb/min If it said CFM or something else then the map itself would look different and one would have to jump through some hoops to figure out where your operating points would be. The chart is corrected because they recalculate each point in the map for a constant input condition. Every day the temperature and station pressure varies and it may vary while you are doing a run. So to level everything out the data captured is post processed so that data from different runs can be compared. The units remain flow in Lb/min therefore if you know the flow rate needed and the goal (constant power to X elevation) then you know exactly where those operating points will fall on the map once you account for the pressure ratio based on altitude.

Usually, for a ground based application one does see operating points going up and to the right, but that is because the points low and to the left are for low engine speeds with little boost and then as RPM increases so does the flow rate (points move right) and usually also the boost value as the turbo spools up (pressure ratio goes up). The fact that operating point based on variable engine speed and boost form a curve going up to the right does not in any way compare to taking a single RPM value at full power and then only changing the elevation, thus the pressure ratio. Mass flow is expected to be constant and all you are expecting to see is the change in pressure ratio.
 
When the units on the X scale change, so too does the shape of the map. You cant have an operating point on 20lb/min without the turbo delivering 20lb/min. Thats the entire reason why the map was switched from volumetric flow to Mass flow in the first place. ...
Wrong. If one doubles or halves the density via pressure at the inducer, the map shape will remain valid. The pressure ratio will not change. Only the true mass flow value will change from the change of input density. This value must be calculated from the map mass flow for every point not SL STP at the inducer. Effectively, the bottom scale will be different for every altitude.

Compressor maps do not handle mass flow directly for varying input conditions. Mass flow map values must be adjusted. Succinctly, true mass flow must be calculated from map mass flow if input varies from standard sea level reference conditions.
Steve Smith (phd) up thread has already posted the calculations needed.
The formula, again, to compute this adjustment for mass flow due to inputs different than standard reference is:
(Map mass value) * Palt/Pref*SQRT(Tref/Talt) = (actual mass flow value at altitude) .

A great help to expedite this arithmetic is a web atmospheric calculator which will furnish ratios directly. It is at:
https://aerospaceweb.org/design/scripts/atmosphere/
It is great because it can use nearly any unit and it can be set to give P and T RATIOS for altitudes vs SL which is just what is needed. Fearing it might disappear, I was able to make a local copy. But the web page is there and it works just fine.


Interestingly, to give the compressor maps similitude and account for Mach effects, there is a built-in root of the temperature ratio in the map so calculations for density ratios are handled with the square root of temperature ratios rather than the temperature ratios themselves as gas laws would indicate. ( density=pressure/absolute temperature) The built-in square root must combine with the furnished value to keep the gas laws happy.

ron
 
Last edited:
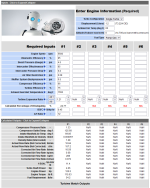
So I have tried the same scenario with a different tool, this time the one from Borg Warner. It presents a lot more data than the tool from Garrett.

Here is the sea level scenario. One has to make a guess of some of the parameters like compressor and turbine efficiency. Borg Warner has no suitable turbo for this flow rate so I cant do anything with their map image. Also if one deleted the into for the other points they still persist on the map with the last valid data.

For the sea level scenario, the uncorrected and corrected mass flows come very close to matching since this is the value where the map was created.
1713499410940.png
1713499462762.png


Now the 15k altitude scenario. I inputed the correct temperature value for 15k altitude 23F
I had to increase the turbine expansion ratio
Actual flow rate is 10.4lb - looks perfect
Corrected flow rate, here is a big difference 17.06lb/min (Mind blown !!) Obviously Im not grasping what this means. Going to have to do a lot more reading. But at least the tool says that the actual flow rate is correct at10.54 lb/min. But apparently the point has to be plotted at a different mass flow point on the map because of the effect of the low density and low temperature of the air at 15k ft elevation...
1713499890170.png
1713499923080.png
Well, I am going to have to eat crow. I have ordered a couple of books on turbocharging, hopefully I can get the process figured out and create an excel tool to use to provide a bit of automation to the process.

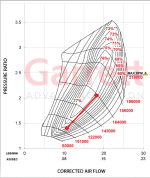
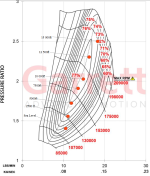
So applying the data back on the original map. Now my conclusion is that the turbo is slightly too small. A bigger unit would have the map moved slightly to the right.

1713501945376.png
 
But the chart says "corrected Air Flow." Why are you assuming that is mass airflow? Very possible that they assume the mass of air at sea level and then correct the flow number to a mass number. If the chart truly was based on mass airflow, I am pretty confident that the Engineer would have labelled the X axis Mass Airflow. He clearly uses the term corrected, so seems logical that he corrects the volume for mass at SL and changes ratio from volume to weight. THere is a big difference between airflow and mass airflow. The former measures the volume of flowing gas and the other measures the weight of flowing gas.
Thank you! Sometimes I feel like I'm shouting into the wind!
 
1713509710142.png

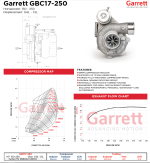
Same points plotted on the next size up turbo from Garret, the GBC17-250

Looks like this is a better match even though it is rated for 250hp.
1713509844017.png
 
I stuffed the donor engine into the trunk of my Focus Sedan this afternoon. Heading out to the hangar to weigh it this eve.

15qBuQfq_o.jpg
 
Had a little weighing party at the hangar today, first up Mitsubishi 3A92 (Mirage 1.2 engine)
1713927195623.jpeg

Next up Toyota 1KR engine. This time with alternator and flywheel, without starter and throttle body. Does have the gearbox brackets fitted and torsional damper on the flywheel. Gearbox adds 16lb
1713927292870.jpeg